By Haris Gazdar and Fuzail Khan
February 26, 2024
As the outcomes of Elections2024 are being debated, one result is not being talked about: the turnout rate. Conventionally, it was 4 percentage points lower in 2024 than in 2018. Measured correctly, however, it remained unchanged. What, if anything, happened?
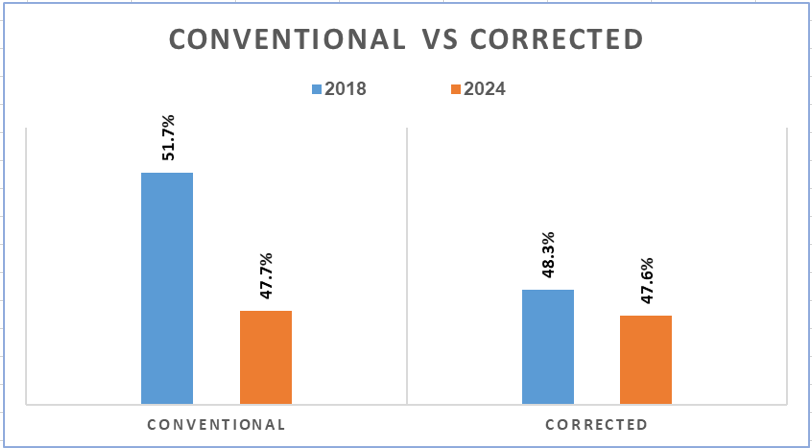
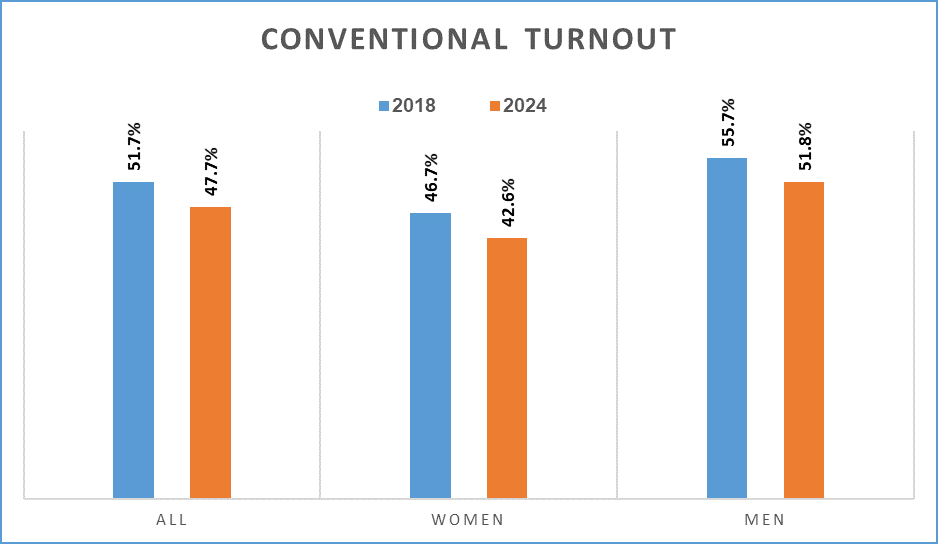
The voter turnout rate, measured in the conventional way, is votes polls as a percentage of registered voters. It was 47.7% in 2024, lower than in 2018. It was lower in 2024 for women and men both. We digitised and used ECP Form 47 data. Check it out for yourself.
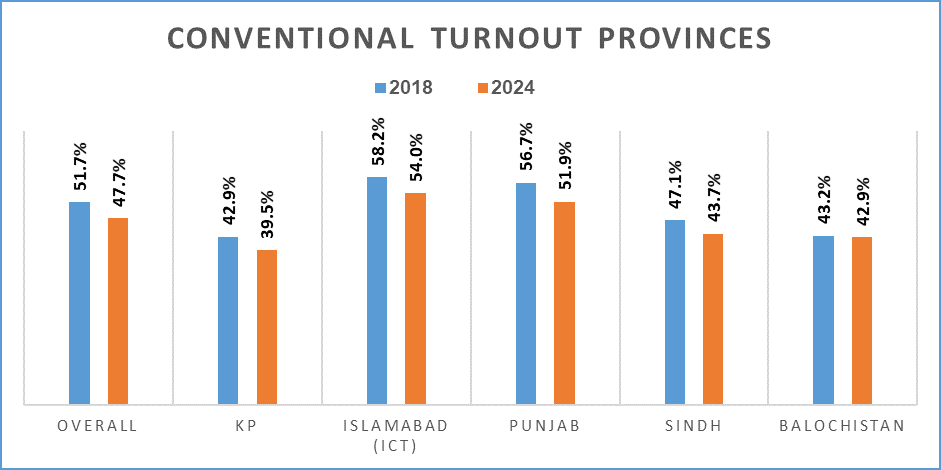
The trend was nationwide, in all of the provinces and in the Islamabad Capital Territory (ICT). The conventionally measured turnout in 2024 was lower than 2018.
The debate about electoral malpractice does not change this picture. We examined PTI claims (posted on their website) about rigging. If we accept their claims for all of 30 NA seats for which they say they have the Form 45, the turnout rate would be marginally lower at 47.1%.
This is because allegations of malpractice focus mainly on the artificial inflation of the PTI rival in most cases, and not so much on the artificial reduction in PTI votes. This, at least, is what has been presented as evidence.
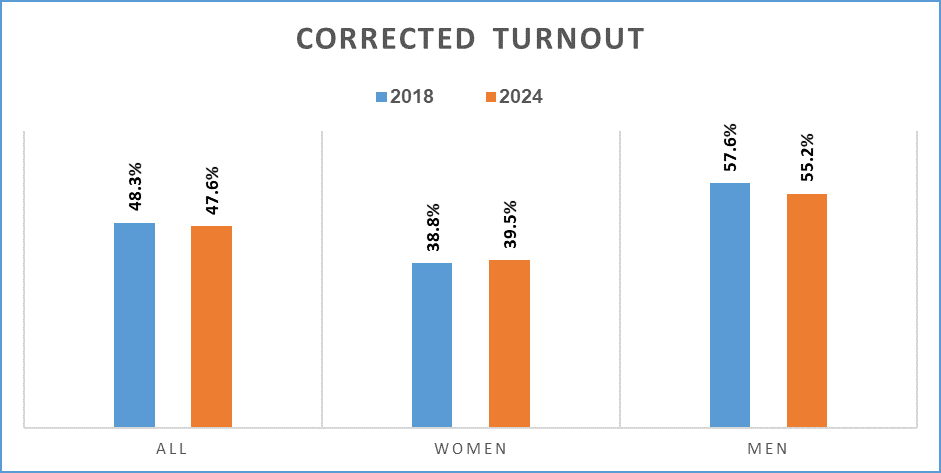
But there are other problems with the conventional method of measuring turnout in Pakistan. We showed in an earlier blog that the NADRA-ECP database link has introduced distortions in the composition of electoral rolls.
There are two salient distortions. One, many women and younger men are not registered because they have not made NADRA CNICs. Two, there are more voters than people in older age groups because NADRA doesn’t automatically remove the deceased from its database.
We estimated corrected turnout rates for 2018 and 2024 – votes cast as a percentage of the total eligile population – or resident citizens of Pakistan aged 18 or above using the census. The corrected turnout rate overall was only marginally lower in 2024 than 2018.
In sum:
Measured correctly turnout didn’t change. No evidence of nationwide wave of protest voting, or of voter boycott.
Despite parties, candidates, ECP, NADRA, and election ‘managers’, non-voters outnumbered voters.
A previous blog and Working Paper discussing why.